How it works
Learn how ST Math can make a difference for your students.


Learn how ST Math can make a difference for your students.
ST Math’s patented, evidence-based approach makes it the only math program that delivers equitable impact for all student groups. Whether they are above or below grade level, classified as gifted and talented or special education, emerging bilingual or native English speakers – all thrive when they finally experience math the way every brain learns.
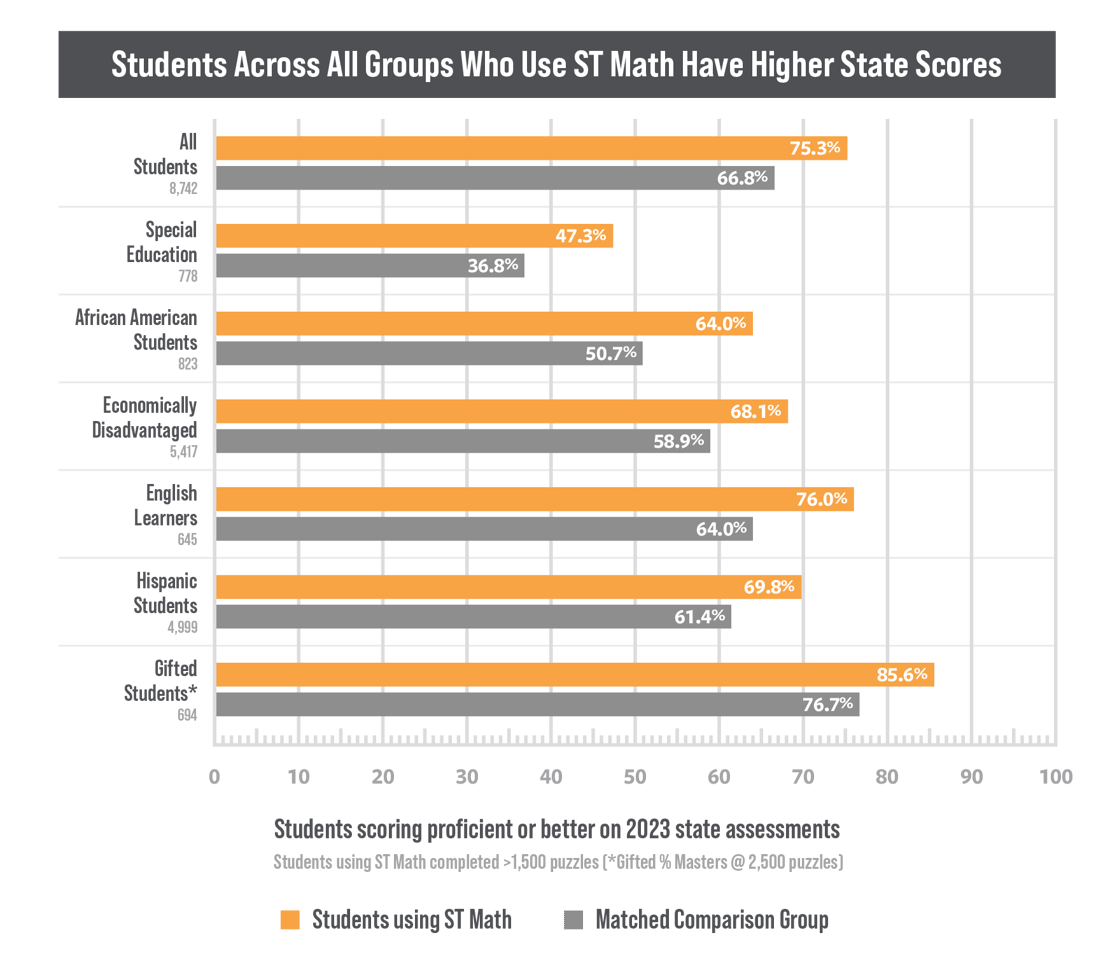
Across all subgroups, students who use ST Math see comparable gains in math learning – that’s equitable impact. Above, results of a quasi-experimental study, with effect sizes all between 0.25 and 0.35.

ST Math schools outgrew similar schools in statewide rank by percentile points.
|
ST Math Implementation |
|
|
|
|
|
|
No ST Math Implementation |
|
|
|
|
ST Math schools outgrew similar schools in statewide rank by percentile points.
|
ST Math Implementation |
|
|
|
|
|
|
No ST Math Implementation |
|
|
|
|
San Diego | View Study
ST Math schools outgrew similar schools in statewide rank by percentile points.
|
ST Math Implementation |
|
|
|
|
|
|
No ST Math Implementation |
|
|
|
|
ST Math schools outgrew similar schools in statewide rank by percentile points.
|
ST Math Implementation |
|
|
|
|
|
|
No ST Math Implementation |
|
|
|
|
Clay Springs Elementary | View Study
ST Math schools outgrew similar schools in statewide rank by percentile points.
|
ST Math Implementation |
|
|
|
|
|
|
No ST Math Implementation |
|
|
|
|
ST Math schools outgrew similar schools in statewide rank by percentile points.
|
ST Math Implementation |
|
|
|
|
|
|
No ST Math Implementation |
|
|
|
|
ST Math schools outgrew similar schools in statewide rank by percentile points.
|
ST Math Implementation |
|
|
|
|
|
|
No ST Math Implementation |
|
|
|
|
ST Math schools outgrew similar schools in statewide rank by percentile points.
|
ST Math Implementation |
|
|
|
|
|
|
No ST Math Implementation |
|
|
|
|
ST Math schools outgrew similar schools in statewide rank by percentile points.
|
ST Math Implementation |
|
|
|
|
|
|
No ST Math Implementation |
|
|
|
|
ST Math schools outgrew similar schools in statewide rank by percentile points.
|
ST Math Implementation |
|
|
|
|
|
|
No ST Math Implementation |
|
|
|
|
ST Math schools outgrew similar schools in statewide rank by percentile points.
|
ST Math Implementation |
|
|
|
|
|
|
No ST Math Implementation |
|
|
|
|
ST Math schools outgrew similar schools in statewide rank by percentile points.
|
ST Math Implementation |
|
|
|
|
|
|
No ST Math Implementation |
|
|
|
|
Gifted | View Study
English Language Learners | View Study
Economically Disadvantaged | View Study
Special Education | View Study
ST Math schools outgrew similar schools in statewide rank by percentile points.
|
ST Math Implementation |
|
|
|
|
|
|
No ST Math Implementation |
|
|
|
|
ST Math schools outgrew similar schools in statewide rank by percentile points.
|
ST Math Implementation |
|
|
|
|
|
|
No ST Math Implementation |
|
|
|
|
ST Math schools outgrew similar schools in statewide rank by percentile points.
|
ST Math Implementation |
|
|
|
|
|
|
No ST Math Implementation |
|
|
|
|
ST Math schools outgrew similar schools in statewide rank by percentile points.
|
ST Math Implementation |
|
|
|
|
|
|
No ST Math Implementation |
|
|
|
|
ST Math schools outgrew similar schools in statewide rank by percentile points.
|
ST Math Implementation |
|
|
|
|
|
|
No ST Math Implementation |
|
|
|
|
ST Math schools outgrew similar schools in statewide rank by percentile points.
|
ST Math Implementation |
|
|
|
|
|
|
No ST Math Implementation |
|
|
|
|
Philadelphia | View Study
ST Math schools outgrew similar schools in statewide rank by percentile points.
|
ST Math Implementation |
|
|
|
|
|
|
No ST Math Implementation |
|
|
|
|
ST Math schools outgrew similar schools in statewide rank by percentile points.
|
ST Math Implementation |
|
|
|
|
|
|
No ST Math Implementation |
|
|
|
|
ST Math schools outgrew similar schools in statewide rank by percentile points.
|
ST Math Implementation |
|
|
|
|
|
|
No ST Math Implementation |
|
|
|
|
Statewide percentile rank is determined for each grade-level by first assigning each grade’s performance a z-score based on the statewide math achievement distribution (Scale Score or Percent Met Standards) for all grades in that state, and then evaluating the percentile rank equivalent to that z-score.
Regardless of which state, assessment, or type of school, ST Math use always boosts math scores. Discover how our constant surveillance of ST Math impacts has revealed all types of student performance on high-stakes standardized assessments:
Will Miller has been a distance learning developer at MIND for the past 4 years and has 11 years experience in education. While earning his MS in Education he worked as a curriculum designer and adult instructor of ESL.
After graduating, Will served for 3 years as an Instructional Designer building online learning, in-person training, and certificate program materials for educational technology companies.
For the past 6 years, he has been a distance learning web developer building HTML5 course and manual frameworks, various web applications, and a central learning hub for adult learners.
The more students use ST Math, the more they learn, and the faster they grow. Schools that demonstrated consistent use of ST Math outgrew similar schools in statewide rank by 14 percentage points.
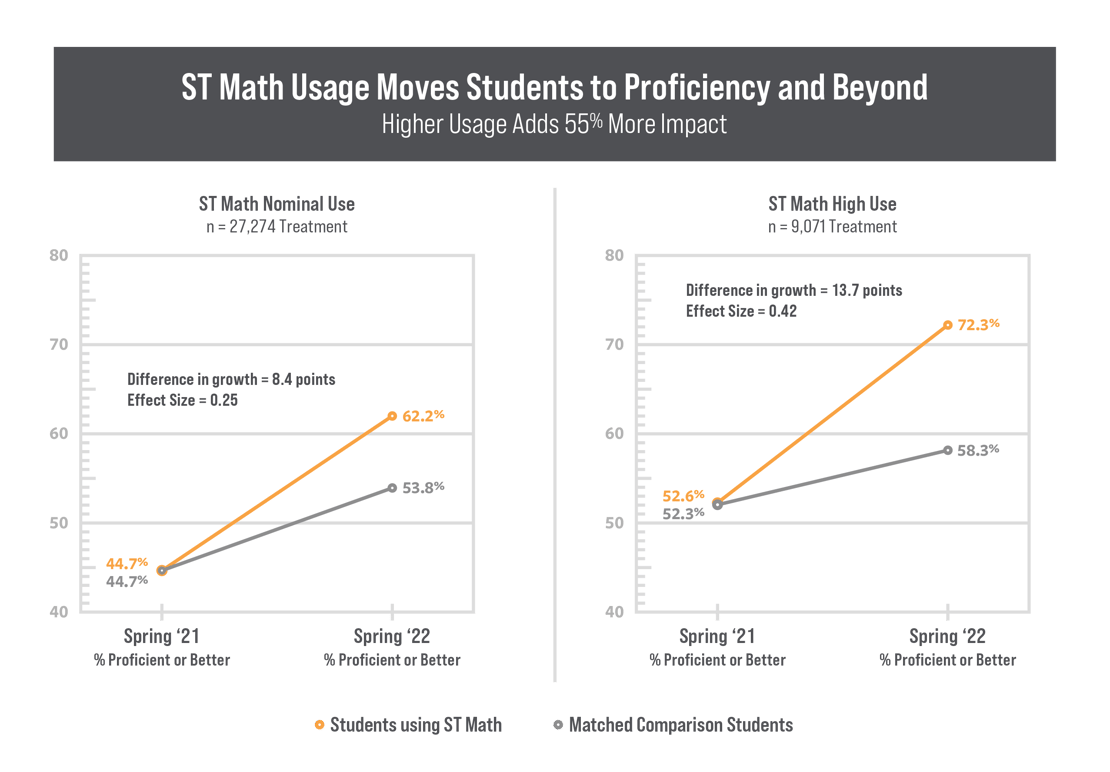
Use ST Math for 60 minutes a week to start seeing growth
I’m encouraged to see that ST Math continues to show significant effects on math achievement. But I’m even more impressed with the breadth of ST Math evaluations towards evaluating every school, every year, which provides a model for other educational technology companies to follow.
MIND has conducted well over 100 studies and evaluations of the impact of ST Math usage at school, district and state levels all across the country, based on state and third party assessments – because we’ve held ourselves accountable for delivering results in every district that adopts ST Math, every year, for decades. With research this robust, you never have to wonder if these results from ST Math use will be repeatable at your school, with your students, on your standardized tests.

Data Spotlights, Implementation Highlights and Educator Perspectives

| Multiple Districts: 2011 v. 2012 | Download PDF |
| Multiple Districts: 2010 to 2013* | Download PDF |
| Fremont: 2011 v. 2012+ | Download PDF |
| Los Angeles: 2010 v. 2011** | Download PDF |
| Los Angeles: 2009 to 2012** | Download PDF |
| Los Angeles: 2011 v. 2012 | Download PDF |
| Los Angeles: 2011 to 2013+ | Download PDF |
| Napa Valley: 2010 v. 2011* | Download PDF |
| Orange County: 2008 to 2011* | Download PDF |
| Orange County: 2009 v. 2011* | Download PDF |
| Orange County: 2010 v. 2011* | Download PDF |
| Orange County: 2011 v. 2012* | Download PDF |
| Silicon Valley: 2009 to 2011** | Download PDF |
| Silicon Valley: 2009 v. 2011* | Download PDF |
| Silicon Valley: 2010 v. 2011** | Download PDF |
| Colorado Springs SD 11: 2011 v. 2012* | Download PDF |
| Colorado Springs: 2011 to 2013+ | Download PDF |
| Multiple Counties: 2011 v. 2012* | Download PDF |
| Orange County Public Schools: 2010 v. 2011* | Download PDF |
| Pinellas County Schools: 2012 v. 2013 | Download PDF |
| Full-state: 2013-2014 (summary) | Download PDF |
| Full-state: 2013-2014 (full report) | Download PDF |
| Chicago: 2010 v. 2011+ | Download PDF |
| Chicago: 2011 to 2012* | Download PDF |
| Full State: 2013-2014 (summary) | Download PDF |
| Full State: 2013-2014 (full report) | Download PDF |
| Full State: 2013 v. 2015 (summary)** | Download PDF |
| Full State: 2013 v. 2015 (full report)** | Download PDF |
| Minneapolis: 2012 v. 2013 | Download PDF |
| Full State: 2012-2014 (summary) | Download PDF |
| Full State: 2012-2014 (full report) | Download PDF |
| Clark County: 2009 to 2011 (7 schools)+ | Download PDF |
| Clark County: 2009 v. 2011 | Download PDF |
| Clark County: 2010 v. 2011 (6 schools)+ | Download PDF |
| Clark County: 2011 to 2013 | Download PDF |
| New York City: 2010 v. 2011 | Download PDF |
| New York City: 2010 to 2012 | Download PDF |
| Cypress-Fairbanks ISD: 2010 v. 2011+ | Download PDF |
| Dallas ISD: 2010 v. 2011** | Download PDF |
| Houston: 2010 v. 2011 | Download PDF |
| Killeen: 2013 to 2015 (summary)* | Download PDF |
| Killeen: 2013 v 2015 (full report)* | Download PDF |
| Killeen: 2014 v. 2015 (summary)** | Download PDF |
| Killeen: 2014 v 2015 (full report)** | Download PDF |
| Multiple Districts: 2012 v. 2013 | Download PDF |
| Multiple Districts: 2012 v. 2013 | Download PDF |
| D.C. Public Schools: 2012 v. 2013** | Download PDF |
| D.C. Public Schools: 2012 v. 2014** | Download PDF |
| D.C. Public Schools: 2012 v. 2014 (full report) | Download PDF |