New MIND Education website coming soon.
NEW : MIND Education website coming soon
How it works
Learn how ST Math can make a difference for your students.

Programs
Experience

Services
Educator Topics
Subscribe to the Newsletter
Subscribe to the Blog
>
Equitable Impact for Every Student
With more than half of students believing they aren’t “math people”, achieving equitable engagement, efforts and impacts for all students is critical. At MIND Education, we create an environment that aligns with brain-based learning principles, fostering deep understanding and critical thinking – the way every human brain is naturally designed to learn.
Our patented, evidence-based approach transforms traditional math learning from rote memorization to deep conceptual understanding, engagement, and problem-solving, reaching all students every year. ST Math engages students of all levels and proficiency, building a conceptual grasp of math that is proven to improve state assessment scores.

Across all subgroups, students who use ST Math see comparable gains in math learning – that’s equitable impact. Above, results of a quasi-experimental study, with effect sizes all between 0.35 and 0.50.


In the 2016-2017 school year, 29,290 students at 185 ST Math® partner schools in 13 states showed an average increase in statewide percentile rankings of 7.88 points, compared to -1.16 points for similar control schools. Dive deeper into the impact of ST Math by state, district and school.
ST Math Advantage
ST Math schools outgrew similar schools in statewide rank by percentile points.
State Percentile Rank
|
ST Math Implementation |
|
|
|
|
|
|
No ST Math Implementation |
|
|
|
|
ST Math Analysis
Additional Studies
Featured Profiles
ST Math Advantage
ST Math schools outgrew similar schools in statewide rank by percentile points.
State Percentile Rank
|
ST Math Implementation |
|
|
|
|
|
|
No ST Math Implementation |
|
|
|
|
San Diego | View Study
Pomona USD, California
Making Math Accessible to the Youngest Learners
ST Math Advantage
ST Math schools outgrew similar schools in statewide rank by percentile points.
State Percentile Rank
|
ST Math Implementation |
|
|
|
|
|
|
No ST Math Implementation |
|
|
|
|
ST Math Analysis
Additional Studies
Featured Profiles
ST Math Advantage
ST Math schools outgrew similar schools in statewide rank by percentile points.
State Percentile Rank
|
ST Math Implementation |
|
|
|
|
|
|
No ST Math Implementation |
|
|
|
|
Clay Springs Elementary | View Study
ST Math Analysis
Featured Profiles
ST Math Advantage
ST Math schools outgrew similar schools in statewide rank by percentile points.
State Percentile Rank
|
ST Math Implementation |
|
|
|
|
|
|
No ST Math Implementation |
|
|
|
|
Cesar Chavez Multicultural Learning Center, Chicago
Inside an Impressive School Turnaround
ST Math Analysis
Featured Profiles
ST Math Advantage
ST Math schools outgrew similar schools in statewide rank by percentile points.
State Percentile Rank
|
ST Math Implementation |
|
|
|
|
|
|
No ST Math Implementation |
|
|
|
|
ST Math Advantage
ST Math schools outgrew similar schools in statewide rank by percentile points.
State Percentile Rank
|
ST Math Implementation |
|
|
|
|
|
|
No ST Math Implementation |
|
|
|
|
ST Math Analysis
Featured Profiles
ST Math Advantage
ST Math schools outgrew similar schools in statewide rank by percentile points.
State Percentile Rank
|
ST Math Implementation |
|
|
|
|
|
|
No ST Math Implementation |
|
|
|
|
Alexander Bruce School, Massachusetts
High ELL Population Demands Unique Solutions
ST Math Analysis
Featured Profiles
ST Math Advantage
ST Math schools outgrew similar schools in statewide rank by percentile points.
State Percentile Rank
|
ST Math Implementation |
|
|
|
|
|
|
No ST Math Implementation |
|
|
|
|
ST Math Analysis
Featured Profiles
ST Math Advantage
ST Math schools outgrew similar schools in statewide rank by percentile points.
State Percentile Rank
|
ST Math Implementation |
|
|
|
|
|
|
No ST Math Implementation |
|
|
|
|
ST Math Analysis
Featured Profiles
ST Math Advantage
ST Math schools outgrew similar schools in statewide rank by percentile points.
State Percentile Rank
|
ST Math Implementation |
|
|
|
|
|
|
No ST Math Implementation |
|
|
|
|
ST Math Analysis
Additional Studies
Featured Profiles
ST Math Advantage
ST Math schools outgrew similar schools in statewide rank by percentile points.
State Percentile Rank
|
ST Math Implementation |
|
|
|
|
|
|
No ST Math Implementation |
|
|
|
|
Gifted | View Study
English Language Learners | View Study
Economically Disadvantaged | View Study
Special Education | View Study
Brazosport ISD, Texas
Seeing was Believing for this Diverse District
Killeen ISD, Texas
A District-wide Math Revolution Started with a Little Penguin
ST Math Advantage
ST Math schools outgrew similar schools in statewide rank by percentile points.
State Percentile Rank
|
ST Math Implementation |
|
|
|
|
|
|
No ST Math Implementation |
|
|
|
|
ST Math Analysis
Featured Profiles
ST Math Advantage
ST Math schools outgrew similar schools in statewide rank by percentile points.
State Percentile Rank
|
ST Math Implementation |
|
|
|
|
|
|
No ST Math Implementation |
|
|
|
|
ST Math Analysis
Featured Profiles
ST Math Advantage
ST Math schools outgrew similar schools in statewide rank by percentile points.
State Percentile Rank
|
ST Math Implementation |
|
|
|
|
|
|
No ST Math Implementation |
|
|
|
|
ST Math Advantage
ST Math schools outgrew similar schools in statewide rank by percentile points.
State Percentile Rank
|
ST Math Implementation |
|
|
|
|
|
|
No ST Math Implementation |
|
|
|
|
ST Math Advantage
ST Math schools outgrew similar schools in statewide rank by percentile points.
State Percentile Rank
|
ST Math Implementation |
|
|
|
|
|
|
No ST Math Implementation |
|
|
|
|
ST Math Analysis
Additional Studies
Featured Profiles
ST Math Advantage
ST Math schools outgrew similar schools in statewide rank by percentile points.
State Percentile Rank
|
ST Math Implementation |
|
|
|
|
|
|
No ST Math Implementation |
|
|
|
|
Philadelphia | View Study
ST Math Advantage
ST Math schools outgrew similar schools in statewide rank by percentile points.
State Percentile Rank
|
ST Math Implementation |
|
|
|
|
|
|
No ST Math Implementation |
|
|
|
|
ST Math Advantage
ST Math schools outgrew similar schools in statewide rank by percentile points.
State Percentile Rank
|
ST Math Implementation |
|
|
|
|
|
|
No ST Math Implementation |
|
|
|
|
ST Math Advantage
ST Math schools outgrew similar schools in statewide rank by percentile points.
State Percentile Rank
|
ST Math Implementation |
|
|
|
|
|
|
No ST Math Implementation |
|
|
|
|
Statewide percentile rank is determined for each grade-level by first assigning each grade’s performance a z-score based on the statewide math achievement distribution (Scale Score or Percent Met Standards) for all grades in that state, and then evaluating the percentile rank equivalent to that z-score.
Research and Accountability, Every Year
Our relentless, consistent, and rigorous research includes hundreds of studies and evaluations at student, school, district, state and national levels, holding us accountable for delivering robust and repeatable results year after year. Every new school is the subject of study. Our foundational methods and studies are validated by third-parties. The comprehensive scope of our research ensures effectiveness across any site setting and demographics.

Real World Evidence: Schools Just Like Yours
Our national-scale studies generate a full spectrum of ST Math “treatment” schools, enabling us to develop substudies on districts of every different type. Regardless of state, assessment type, or school setting, ST Math boosts math scores with the hallmark ST Math pattern of benefitting all performance levels. If you don’t see your district type in the mix below, contact us, and we can provide a study tailored to meet your needs.
Twana Young
Director, Professional Development
Will Miller has been a distance learning developer at MIND for the past 4 years and has 11 years experience in education. While earning his MS in Education he worked as a curriculum designer and adult instructor of ESL.
After graduating, Will served for 3 years as an Instructional Designer building online learning, in-person training, and certificate program materials for educational technology companies.
For the past 6 years, he has been a distance learning web developer building HTML5 course and manual frameworks, various web applications, and a central learning hub for adult learners.
High Need
0.67 z-score effect size*
81 schools
9,432 students✝
16 states
9,432 students✝
16 states
AL, AZ, CA, CO, FL, IA, IL, LA, MA, MO, MS, NM, NV, NY, UT, WI
Low need
0.26 z-score effect size*
69 schools
9,999 students✝
13 states
9,999 students✝
13 states
AZ, CA, IA, IL, MA, MT, NH, NJ, NV, NY, OH, UT, VA
High Performing
0.87 z-score effect size*
57 schools
6,681 students✝
14 states
6,681 students✝
14 states
AR, AZ, CA, FL, IA, IL, MA, MT, NV, NY, PA, TX, UT, VA
Low Performing
0.98 z-score effect size*
41 schools
3,576 students✝
13 states
3,576 students✝
13 states
AR, CA, CT, FL, IA, MA, MO, MT, NH, TX, UT, VA, WI
High English Learner
Rural District
0.53 z-score effect size*
76 schools
7,721 students✝
18 states
7,721 students✝
18 states
AZ, CA, CO, GA, IA, MA, MI, MN, MO, NC, NJ, NV, NY, OH, PA, TX, UT, VA
Large District
0.34 z-score effect size*
307 schools
50,211 students✝
16 states
50,211 students✝
16 states
AZ, CA, CO, DC, FL, GA, IL, LA, MA, MD, NM, NV, NY, TX, UT, WI
Small District
0.54 z-score effect size*
45 schools
3,070 students✝
12 states
3,070 students✝
12 states
AZ, CA, IA, IN, MI, MN, NJ, NV, NY, PA, TX, UT
High Hispanic Enrollment
0.44 z-score effect size*
102 schools
12,907 students✝
13 states
12,907 students✝
13 states
AR, AZ, CA, CO, IL, MA, NJ, NM, NV, NY, TX, UT, WI
High African American Enrollment
0.26 z-score effect size*
67 schools
11,218 students✝
17 states
11,218 students✝
17 states
AL, CA, CT, FL, GA, IA, IL, LA, MA, MO, MS, NC, NJ, NV, NY, TX, VA
*Statistically significant. †Analyzed by grade-level datasets
Increasing Usage Improves Results
The more students use ST Math, the more they learn, and the faster they grow. Schools that demonstrated consistent use of ST Math outgrew similar schools in statewide rank by 14 percentage points.
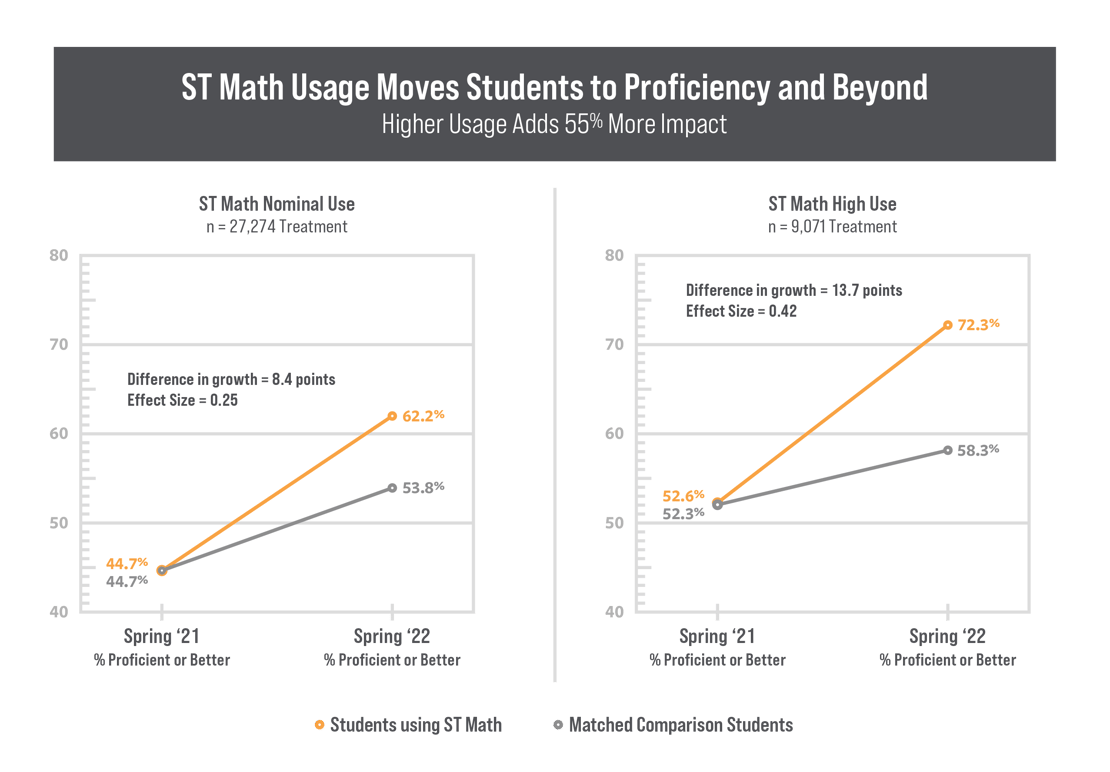
Use ST Math for 60 minutes a week to start seeing growth
I’m encouraged to see that ST Math continues to show significant effects on math achievement. But I’m even more impressed with the breadth of ST Math evaluations towards evaluating every school, every year, which provides a model for other educational technology companies to follow.
— Tonika Cheek Clayton
Managing Partner, New Schools Venture Funds
Profiles in Success
Data Spotlights, Implementation Highlights and Educator Perspectives


Previous Reports
KEY + 0.05 < p ≤ 0.1 * 0.01 < p ≤ 0.05 ** p ≤ 0.01
Arizona
| Multiple Districts: 2011 v. 2012 | Download PDF |
| Multiple Districts: 2010 to 2013* | Download PDF |
California
| Fremont: 2011 v. 2012+ | Download PDF |
| Los Angeles: 2010 v. 2011** | Download PDF |
| Los Angeles: 2009 to 2012** | Download PDF |
| Los Angeles: 2011 v. 2012 | Download PDF |
| Los Angeles: 2011 to 2013+ | Download PDF |
| Napa Valley: 2010 v. 2011* | Download PDF |
| Orange County: 2008 to 2011* | Download PDF |
| Orange County: 2009 v. 2011* | Download PDF |
| Orange County: 2010 v. 2011* | Download PDF |
| Orange County: 2011 v. 2012* | Download PDF |
| Silicon Valley: 2009 to 2011** | Download PDF |
| Silicon Valley: 2009 v. 2011* | Download PDF |
| Silicon Valley: 2010 v. 2011** | Download PDF |
Colorado
| Colorado Springs SD 11: 2011 v. 2012* | Download PDF |
| Colorado Springs: 2011 to 2013+ | Download PDF |
Florida
| Multiple Counties: 2011 v. 2012* | Download PDF |
| Orange County Public Schools: 2010 v. 2011* | Download PDF |
| Pinellas County Schools: 2012 v. 2013 | Download PDF |
| Full-state: 2013-2014 (summary) | Download PDF |
| Full-state: 2013-2014 (full report) | Download PDF |
Illinois
| Chicago: 2010 v. 2011+ | Download PDF |
| Chicago: 2011 to 2012* | Download PDF |
Iowa
| Full State: 2013-2014 (summary) | Download PDF |
| Full State: 2013-2014 (full report) | Download PDF |
| Full State: 2013 v. 2015 (summary)** | Download PDF |
| Full State: 2013 v. 2015 (full report)** | Download PDF |
Minnesota
| Minneapolis: 2012 v. 2013 | Download PDF |
| Full State: 2012-2014 (summary) | Download PDF |
| Full State: 2012-2014 (full report) | Download PDF |
Nevada
| Clark County: 2009 to 2011 (7 schools)+ | Download PDF |
| Clark County: 2009 v. 2011 | Download PDF |
| Clark County: 2010 v. 2011 (6 schools)+ | Download PDF |
| Clark County: 2011 to 2013 | Download PDF |
New York
| New York City: 2010 v. 2011 | Download PDF |
| New York City: 2010 to 2012 | Download PDF |
Texas
| Cypress-Fairbanks ISD: 2010 v. 2011+ | Download PDF |
| Dallas ISD: 2010 v. 2011** | Download PDF |
| Houston: 2010 v. 2011 | Download PDF |
| Killeen: 2013 to 2015 (summary)* | Download PDF |
| Killeen: 2013 v 2015 (full report)* | Download PDF |
| Killeen: 2014 v. 2015 (summary)** | Download PDF |
| Killeen: 2014 v 2015 (full report)** | Download PDF |
Virginia
| Multiple Districts: 2012 v. 2013 | Download PDF |
Washington
| Multiple Districts: 2012 v. 2013 | Download PDF |
Washington, D.C.
| D.C. Public Schools: 2012 v. 2013** | Download PDF |
| D.C. Public Schools: 2012 v. 2014** | Download PDF |
| D.C. Public Schools: 2012 v. 2014 (full report) | Download PDF |
Start seeing equitable impact for your students.


Copyright © 2024 MIND Education®. All rights reserved.